


Six Sigma is a business management strategy originally developed by Motorola, USA in 1981.[1] As of 2010, it enjoys widespread application in many sectors of industry, although its application is not without controversy.[update]
Six Sigma seeks to improve the quality of process outputs by identifying and removing the causes of defects (errors) and minimizing variability in manufacturing and business processes.[2] It uses a set of quality management methods, including statistical methods, and creates a special infrastructure of people within the organization ("Black Belts", "Green Belts", etc.) who are experts in these methods.[2] Each Six Sigma project carried out within an organization follows a defined sequence of steps and has quantified financial targets (cost reduction or profit increase).[2]
The term six sigma originated from terminology associated with manufacturing, specifically terms associated with statistical modelling of manufacturing processes. The maturity of a manufacturing process can be described by a sigma rating indicating its yield, or the percentage of defect-free products it creates. A six-sigma process is one in which 99.997% of the products manufactured are statistically expected to be free of defects(3.4 defects per 1 million). Motorola set a goal of "six sigmas" for all of its manufacturing operations, and this goal became a byword for the management and engineering practices used to achieve it.
Six Sigma originated as a set of practices designed to improve manufacturing processes and eliminate defects, but its application was subsequently extended to other types of business processes as well.[3] In Six Sigma, a defect is defined as any process output that does not meet customer specifications, or that could lead to creating an output that does not meet customer specifications.[2]
Bill Smith first formulated the particulars of the methodology at Motorola in 1986.[4] Six Sigma was heavily inspired by six preceding decades of quality improvement methodologies such as quality control, TQM, and Zero Defects,[5][6] based on the work of pioneers such as Shewhart, Deming, Juran, Ishikawa, Taguchi and others.
Like its predecessors, Six Sigma doctrine asserts that:
Features that set Six Sigma apart from previous quality improvement initiatives include:
The term "Six Sigma" comes from a field of statistics known as process capability studies. Originally, it referred to the ability of manufacturing processes to produce a very high proportion of output within specification. Processes that operate with "six sigma quality" over the short term are assumed to produce long-term defect levels below 3.4 defects per million opportunities (DPMO).[7][8] Six Sigma's implicit goal is to improve all processes to that level of quality or better.
Six Sigma is a registered service mark and trademark of Motorola Inc.[9] As of 2006 Motorola reported over US$17 billion in savings[10] from Six Sigma.[update]
Other early adopters of Six Sigma who achieved well-publicized success include Honeywell (previously known as AlliedSignal) and General Electric, where Jack Welch introduced the method.[11] By the late 1990s, about two-thirds of the Fortune 500 organizations had begun Six Sigma initiatives with the aim of reducing costs and improving quality.[12]
In recent years, some practitioners have combined Six Sigma ideas with [update]lean manufacturing to yield a methodology named Lean Six Sigma.
Six Sigma projects follow two project methodologies inspired by Deming's Plan-Do-Check-Act Cycle. These methodologies, composed of five phases each, bear the acronyms DMAIC and DMADV.[12]
The DMAIC project methodology has five phases:
The DMADV project methodology, also known as DFSS ("Design For Six Sigma"),[12] features five phases:
Within the individual phases of a DMAIC or DMADV project, Six Sigma utilizes many established quality-management tools that are also used outside of Six Sigma. The following table shows an overview of the main methods used.
|
|
One key innovation of Six Sigma involves the "professionalizing" of quality management functions. Prior to Six Sigma, quality management in practice was largely relegated to the production floor and to statisticians in a separate quality department. Formal Six Sigma programs borrow martial arts ranking terminology to define a hierarchy (and career path) that cuts across all business functions.
Six Sigma identifies several key roles for its successful implementation.[13]
Some organizations use additional belt colours, such as Yellow Belts, for employees that have basic training in Six Sigma tools.
In the United States, Six Sigma certification for both Green and Black Belts is offered by the Institute of Industrial Engineers[14] and by the American Society for Quality.[15]
In addition to these examples, there are many other organizations and companies that offer certification. There currently is no central certification body, neither in the United States nor anywhere else in the world.
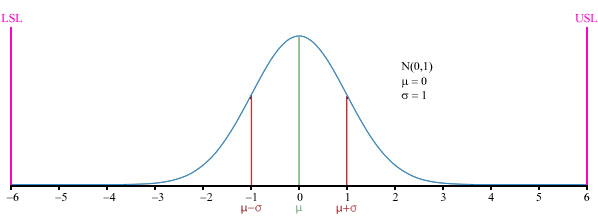
The term "six sigma process" comes from the notion that if one has six standard deviations between the process mean and the nearest specification limit, as shown in the graph, practically no items will fail to meet specifications.[8] This is based on the calculation method employed in process capability studies.
Capability studies measure the number of standard deviations between the process mean and the nearest specification limit in sigma units. As process standard deviation goes up, or the mean of the process moves away from the center of the tolerance, fewer standard deviations will fit between the mean and the nearest specification limit, decreasing the sigma number and increasing the likelihood of items outside specification.[8]
Experience has shown that processes usually do not perform as well in the long term as they do in the short term.[8] As a result, the number of sigmas that will fit between the process mean and the nearest specification limit may well drop over time, compared to an initial short-term study.[8] To account for this real-life increase in process variation over time, an empirically-based 1.5 sigma shift is introduced into the calculation.[8][16] According to this idea, a process that fits six sigmas between the process mean and the nearest specification limit in a short-term study will in the long term only fit 4.5 sigmas – either because the process mean will move over time, or because the long-term standard deviation of the process will be greater than that observed in the short term, or both.[8]
Hence the widely accepted definition of a six sigma process as one that produces 3.4 defective parts per million opportunities (DPMO). This is based on the fact that a process that is normally distributed will have 3.4 parts per million beyond a point that is 4.5 standard deviations above or below the mean (one-sided capability study).[8] So the 3.4 DPMO of a "Six Sigma" process in fact corresponds to 4.5 sigmas, namely 6 sigmas minus the 1.5 sigma shift introduced to account for long-term variation.[8] This takes account of special causes that may cause a deterioration in process performance over time and is designed to prevent underestimation of the defect levels likely to be encountered in real-life operation.[8]
The table[17][18] below gives long-term DPMO values corresponding to various short-term sigma levels.
Note that these figures assume that the process mean will shift by 1.5 sigma toward the side with the critical specification limit. In other words, they assume that after the initial study determining the short-term sigma level, the long-term Cpk value will turn out to be 0.5 less than the short-term Cpk value. So, for example, the DPMO figure given for 1 sigma assumes that the long-term process mean will be 0.5 sigma beyond the specification limit (Cpk = –0.17), rather than 1 sigma within it, as it was in the short-term study (Cpk = 0.33). Note that the defect percentages only indicate defects exceeding the specification limit to which the process mean is nearest. Defects beyond the far specification limit are not included in the percentages.
| Sigma level | DPMO | Percent defective | Percentage yield | Short-term Cpk | Long-term Cpk |
|---|---|---|---|---|---|
| 1 | 691,462 | 69% | 31% | 0.33 | –0.17 |
| 2 | 308,538 | 31% | 69% | 0.67 | 0.17 |
| 3 | 66,807 | 6.7% | 93.3% | 1.00 | 0.5 |
| 4 | 6,210 | 0.62% | 99.38% | 1.33 | 0.83 |
| 5 | 233 | 0.023% | 99.977% | 1.67 | 1.17 |
| 6 | 3.4 | 0.00034% | 99.99966% | 2.00 | 1.5 |
| 7 | 0.019 | 0.0000019% | 99.9999981% | 2.33 | 1.83 |